2021 Salary Survey Shows Market Rebound
- By Renee Dustman
- In AAPC News
- February 1, 2022
- 2 Comments

Healthcare industry recovers amid ongoing public health emergency.
AAPC’s 2021 Salary Survey shows that our members are resilient, forward-thinking leaders in the business of healthcare who persevere in difficult times through certification, education, and networking.
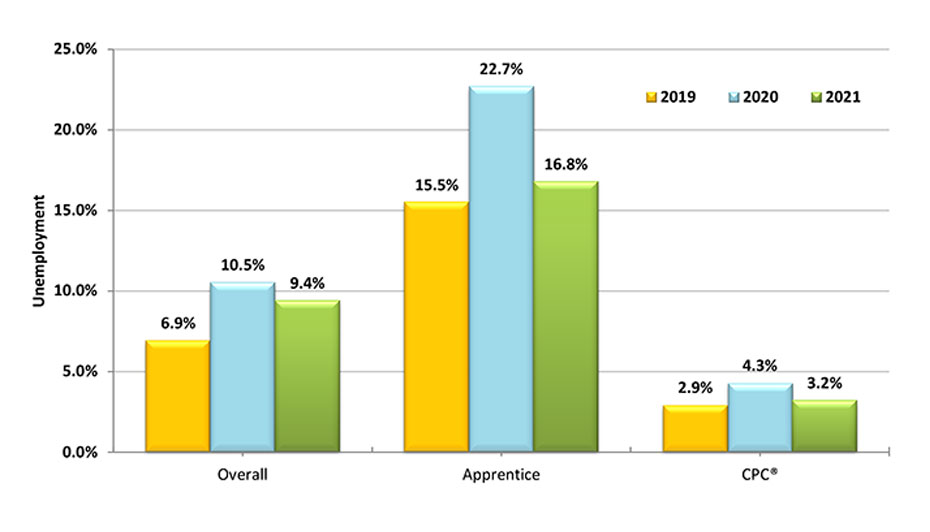
Nearly every industry has felt the effects of the COVID-19 pandemic, possibly none more than the healthcare industry. While hospitals were at capacity with patients suffering from the coronavirus and healthcare providers were working around the clock caring for the critically ill, other sectors were put on hold. A directive from the White House ordering no elective surgeries forced hospitals and ambulatory surgery centers to lay off or furlough thousands of staff — medical coders and billers included. Physician practices were also affected when patients began prioritizing social distancing over preventive care. Unemployment rates in the healthcare industry skyrocketed; last year’s salary survey showed unemployment among AAPC members, alone, rose from 6.9 percent in 2019 to 11.3 percent in 2020 (compared to a nationwide rate of 14.8 percent in April 2020).

We have better news this year.
Unemployment Is Down
With the rollout of COVID-19 vaccinations, fewer people dying from complications of the coronavirus, and the expanded availability of telehealth services, the nation started to recover in 2021. The U.S. unemployment rate fell by a 0.4 percentage point to 4.2 percent in November 2021 and the number of unemployed fell by 542,000 to 6.9 million, according to the Bureau of Labor Statistics (BLS). “Both measures are down considerably from their highs at the end of the February-April 2020 recession,” reports the BLS in a December 2021 news release. But it’s not over yet. The numbers “remain above their levels prior to the coronavirus (COVID-19) pandemic (3.5 percent and 5.7 million, respectively, in February 2020),” BLS adds.
The same can be said for the health sector. As shown in Chart A: Unemployment, there were fewer unemployed healthcare business professionals in 2021 than in 2020, but the numbers show we’re not out of the woods yet. The overall unemployment rate among survey-takers was 9.4 percent in 2021. Those with the Certified Professional Coder-Apprentice (CPC-A®) credential led the pack for acquiring gainful employment last year, going from an unemployment rate of 22.7 percent to 16.8 percent, but they have a lot more ground to cover than CPCs, who have historically stayed well below the national average for unemployment.
Salaries Are Up
In 2020, Medicare spending totaled $829.5 billion, hospital spending reached $1.3 trillion, and physician and clinical services spending amounted to $809.5 billion, according to the Centers for Medicare & Medicaid Services (CMS). Private health insurance spending decreased 1.2 percent to $1.15 trillion. Overall, the United States saw a 9.7 percent growth in total national healthcare spending in 2020. This growth is indicative to the rebound in jobs and salaries we’re seeing now.
As shown in Chart B: Salary by Experience, many of our members saw salary increases in 2021 — some even exceeding pre-pandemic levels. Naturally, the more you know the more you’re worth. Those with 31 or more years of experience in the business of healthcare reported a 3.9 percent increase in 2021, bringing the average annual salary for that group to $73,150. New hires with little to no experience reported a starting salary of $38,930 (roughly $19 per hour). This is a 3.2 percent increase over last year, or 2.1 percent when adjusted for last year’s negative 1.1 percent increase.
Members with two to four years’ experience saw a 4 percent pay increase; those with five to nine years’ experience saw a 3.9 percent increase; and members with 10 to 15 years’ experience saw a 3.1 percent increase. Beyond that, annual increase percentages historically level off to standard inflation rates — unless there’s an economic downturn, at which time members with 26 to 30 years’ experience historically get hit the hardest.

We also looked at salaries based on job responsibilities, credentials held, and geographical location. As shown in Chart C: Salary by Job Responsibility, coding/billing managers and educators come out on top, earning on average more than $69,000 annually. Practice managers come in at a close second at $64,146, followed by auditors at $63,661. The average salary for medical coders and billers in 2021 was $50,000. These numbers are much improved from 2020, indicating market recovery.

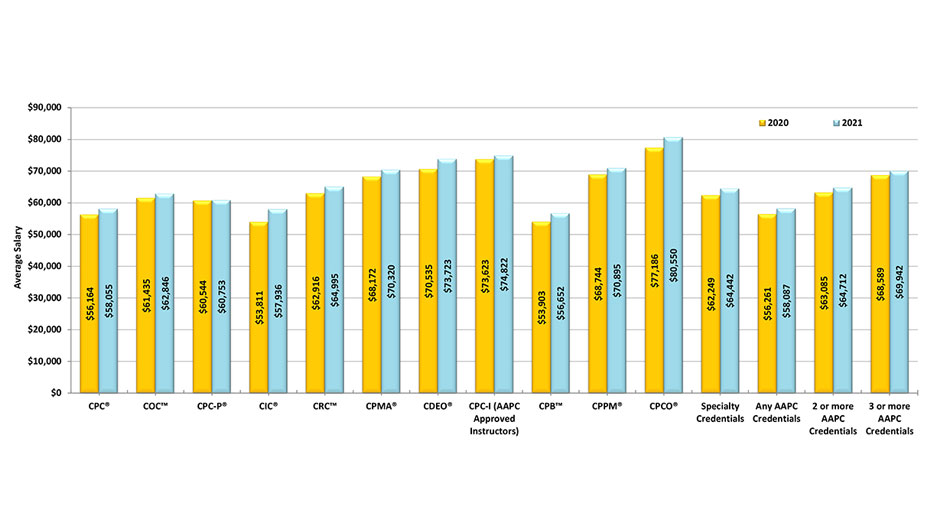
Chart D: Salary by Credential shows salaries are not only up from 2020 levels but, for the most part, have exceeded pre-pandemic levels. As is consistent with the figures in Chart D, CPCs and those with the Certified Professional Biller (CPB™) credential continue to creep up to respectable levels: $58,055 for CPCs and $56,652 for CPBs. The Certified Professional Compliance Officer (CPCO®) credential merited the highest salary among our members at $80,550 last year. AAPC Approved Instructors came in a close second in 2021 at $74,822. As mentioned, hospitals were hit hard by the pandemic and inpatient coders felt the effects in 2020, losing an average 14.8 percent in compensation. We’re pleased to report salaries for those with the Certified Inpatient Coder (CIC®) credential rebounded an average 7.7 percent last year.
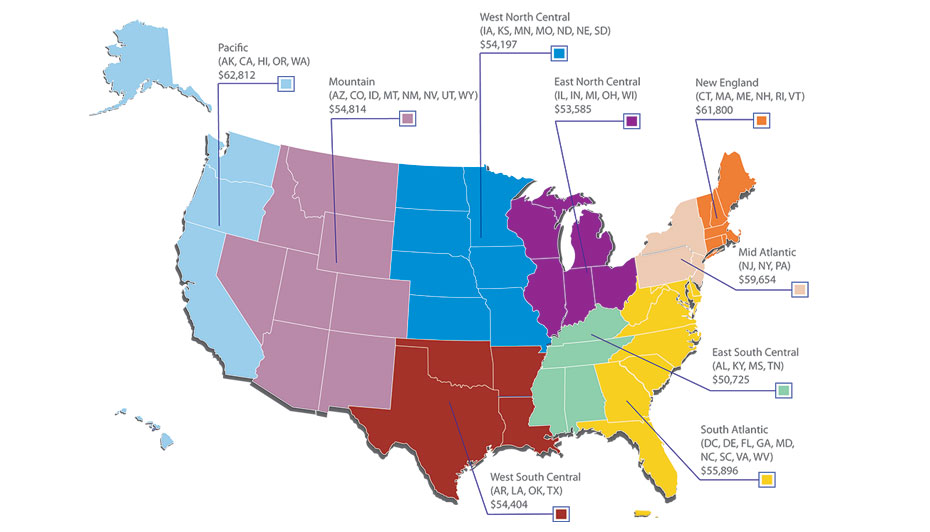
When looking at Chart E: Salary by Region, we can see that the average salary for members also varies depending on geographical location. On the West Coast, the average salary is $62,812 while in the East South Central region members average $50,725. The differences in average salaries are reflective of the varying cost of living indices across the country. For example, according to Salary.com, the cost-of-living index for San Francisco is 186.08 percent compared to 91.21 percent for Louisville, Ky.
AAPC Members Seek Higher Education
Education levels also weigh in on the perceived value of employees. According to our survey, 19.2 percent of AAPC members do not have a formal college degree; 51.6 percent have some college or an associate degree, 22.3 percent have a bachelor’s, and 6.9 percent have a master’s degree or higher.
Our members historically seek education during recessions or other periods of high unemployment, but these past couple of years have been extraordinary times. Health concerns, financial strain, childcare issues for children learning virtually at home, behavioral health issues, and so on, resulted in fewer members earning degrees in 2020. That trend continued into 2021 for undergrad degrees, but the number of members seeking graduate degrees rebounded to pre-pandemic levels (21.3 percent in 2021 compared to 15.5 percent in 2020).
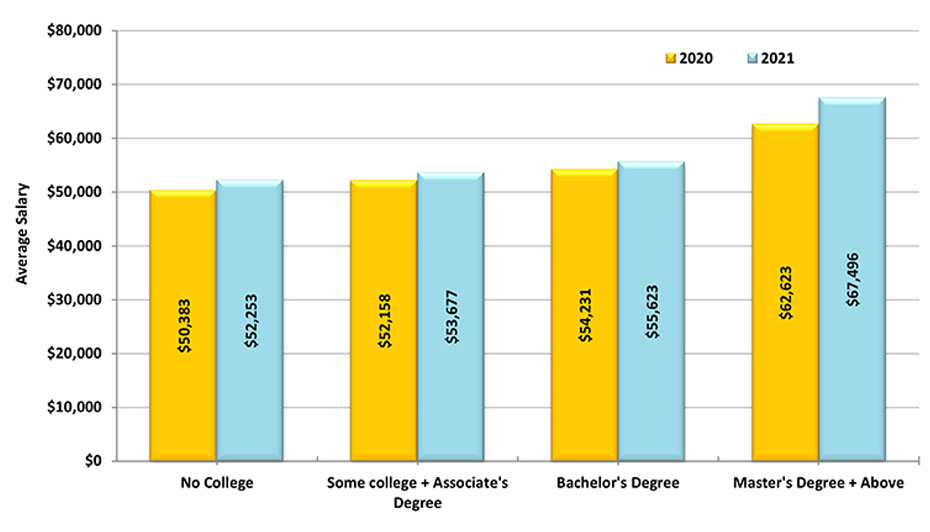
The decision to earn a graduate degree makes sense when you look at salary levels. As shown in Chart F: Salary by Education, members with a master’s or higher consistently earn more than those without a college education. Of interest, though, is the evidence that salaries for members with no college education have consistently increased over the years while salaries for members with graduate degrees are more transient. In fact, those with no college education saw the biggest pay increase in 2021 than in all our years of conducting this survey. Those with a college education saw their salaries go up, but not to pre-pandemic levels.
Workplace Venues Continue to Morph
Compensation also depends on the healthcare setting, which has been undergoing a transformation. For hospitals: “Healthcare mergers and acquisitions surged in 2021, growing 56% in the 12 months through Nov. 15 versus 2020,” Fierce Healthcare reports. The American Hospital Association says we can expect to see more large health systems as financial pressures continue and “providers see a lifeline in partnering with larger organizations to remain competitive in today’s health care landscape.” Our salary survey confirms this trend.
As shown in Chart G: Workplace, 19.8 percent of AAPC members reported being employed by a health system in 2021, followed by 14.4 percent being employed by a hospital, and 11.1 percent employed by a solo or small group physician practice. This trend has not changed much in recent years, but a historical overview shows that the number of members employed by small, medium, and large group practices has declined by half since 2010.

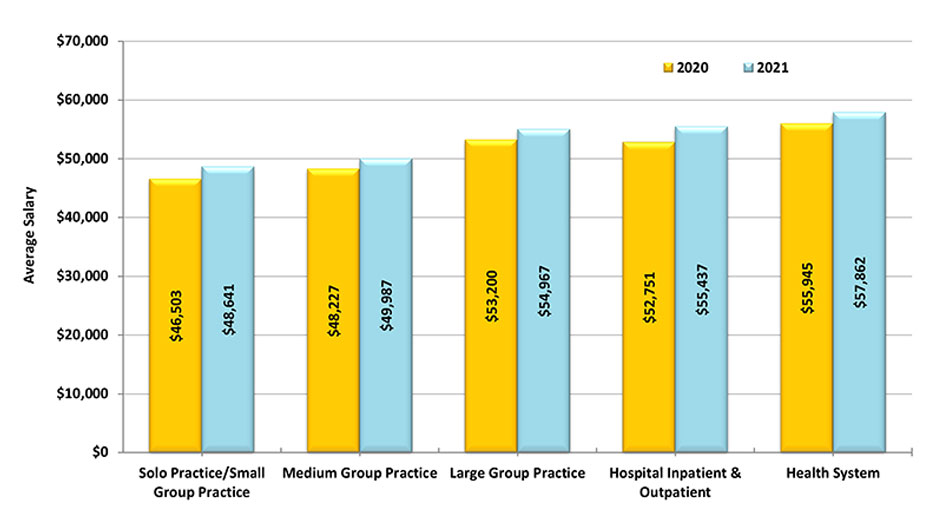
Of note, health systems seemingly pay better than other settings. As shown by Chart H: Salary by Workplace, members earned an average $57,862 last year, compared to $48,641 for those working at a solo or small group practice.
The number of members employed by billing companies has also declined over the years. Yvonne Dailey, CPC, CPC-I, CPB, of Dailey Billing Services, Inc., says she feels the decline in members employed by billers is because there are fewer independent billing companies. “Providers started to bring everything in-house with the boom of electronic medical records and practice management systems,” she said. But it looks like the tides are turning. “Now, three to five years later, they are finding they do need coders that can do both billing and coding.” Dailey says that in the last month or so, five large companies have approached her, looking for someone to do their billing and coding “because they don’t have coders doing the work on the system and they are bleeding out,” she said.
See the complete results of the AAPC 2021 Salary Survey on our website.
Employee Benefits and Workplace Flexibility Count
Salary isn’t the only consideration when seeking employment; it’s also important to know what sort of benefits organizations are offering their employees. For the most part, employers are covering in full or in part the cost of their employees’ health insurance. It’s encouraging to see that 80.7 percent of our members’ professional association dues are paid by their employers. Other common benefits for fulltime employment include paid holidays, sick leave, and vacation. About 77 percent report having a retirement plan through work. And more than half report having a flexible schedule.
Most AAPC members (57.7 percent) are held to a 40-hour work week, but some (26.7 percent) report working up to 50 hours per week. And most members (70.8 percent) are paid hourly. Perhaps because of this, most (63.7 percent) are not held to production standards. This data hasn’t changed much over the years, but the public health emergency for COVID-19 has certainly influenced the office dynamic. The number of members working remotely has increased significantly the past two years. We’re also seeing a new trend: 19.7 percent of members who responded to our survey said they split their time between home and office.
New Challenges Bring New Opportunities
The future is bright for medical coders, billers, auditors, compliance officers, practice managers, and the many other avenues in healthcare our members travel down. Industry trends such as artificial intelligence, telehealth, population health, value-based care, and medical record interoperability promise new career opportunities for those who are ready.
How We Conduct This Survey
We conducted this salary survey between Sept. 1, 2021, and Oct. 24, 2021, using SurveyMonkey. The results shown here are averages based on 24,000 respondents who have an average 12.1 years’ experience.
Resources:
BLS, The Employment Situation — November 2021. Dec. 3, 2021. News Release
CMS Newsroom. Dec. 15, 2021. Press Release
Salary.com: www.salary.com
Landi, Heather, Fierce Healthcare. Dec. 10, 2021.
www.fiercehealthcare.com/finance/health-services-m-a-deals-surged-2021-here-are-some-trends-could-impact-deal-making-next
Martin, Geoffrey. AHA Trustee Services.
https://trustees.aha.org/top-10-emerging-trends-health-care-2021-new-normal
Analytics Contributor: Dave Blackmer, MSC, has over a decade of experience in healthcare marketing and operations. He currently oversees all the marketing at CenExel, a leading clinical research site network. He has published and collaborated on dozens of industry articles and is a frequent speaker at healthcare, marketing, and tech conferences around the country. Blackmer earned a master’s degree in strategic communication from Westminster College.

- HCPCS Level II July Update Files Now Available - May 3, 2024
- Laboratories: Get Ready for PLA Code Changes - May 2, 2024
- FY 2025 IPPS/LTCH Proposed Rule Forecasts the Future for Hospitals - May 2, 2024


Does anyone have a suggestion for me? I am interested in fraud investigation/auditor.
I would love to take more classes to further my career and I think auditing would be a good start then move to fraud.