AAPC’s 2020 Salary Survey: Results Are In!
- By Renee Dustman
- In AAPC News
- February 1, 2021
- 2 Comments

Members make the most of a bad year and prepare to rally.
AAPC’s 2020 Salary Survey is a reminder of the kind of year it was. After the COVID-19 pandemic forced the United States to declare a public health emergency (PHE) early in the year, emergency medicine doctors and nurses were busier than ever. Meanwhile, other health settings looked like ghost towns after the government banned all elective procedures in the first half of 2020. This outturn had a trickle-down effect on medical coders and billers; many AAPC members who worked for primary care or specialty practices were furloughed for part of the year or, sadly, let go. This was not the only turn of events, however. AAPC’s 13th annual Salary Survey shows how resilient our members are in the face of adversity. We encourage you to use the following information to assess your position and progression in the business of healthcare as you prepare to rally in 2021!
Are You Being Paid What You’re Worth?
Let’s begin with the information everyone wants to know: How much money do medical coders, billers, auditors, and other healthcare business professionals make? That is a complicated question because there are many factors that determine compensation, including job responsibility, education, years of experience, credentials, facility type, and geographic location (not to mention chutzpah to ask for what you’re worth). Let’s look at how each of these factors measures up.
Consider Your Job Description
Job responsibility usually carries the most weight in determining salary. As shown in Graph 1, medical coders and billers continue to earn considerably less money than auditors, managers, and educators. If salary is any indication, auditors have clearly become more valuable to employers based on a reported 29 percent increase in pay since 2008. Educators (for example, AAPC Approved Instructors) have fared even better, enjoying a 35 percent increase in pay over the same time span.
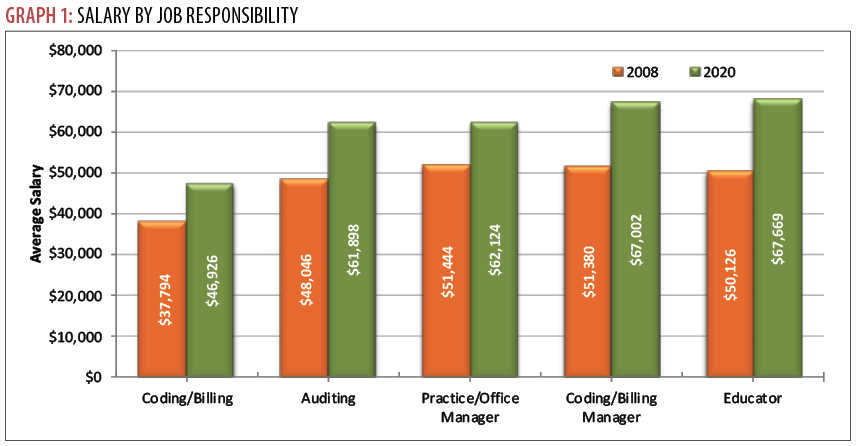
Salaries are increasing across the board, however, which shows how essential all of these roles have become to the healthcare industry. Likewise, employers are asking more from individuals in these roles. As shown in Graphs 2 and 3 and Table A, for those who have production standards and accuracy rate requirements (typically those who process claims), expectations are high.
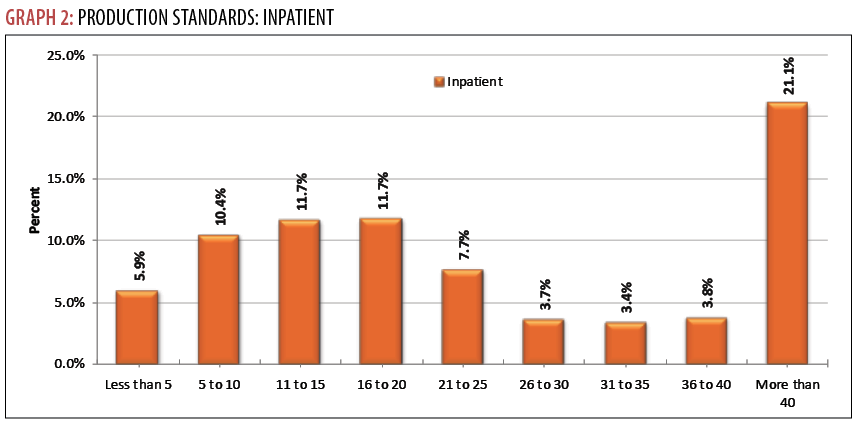
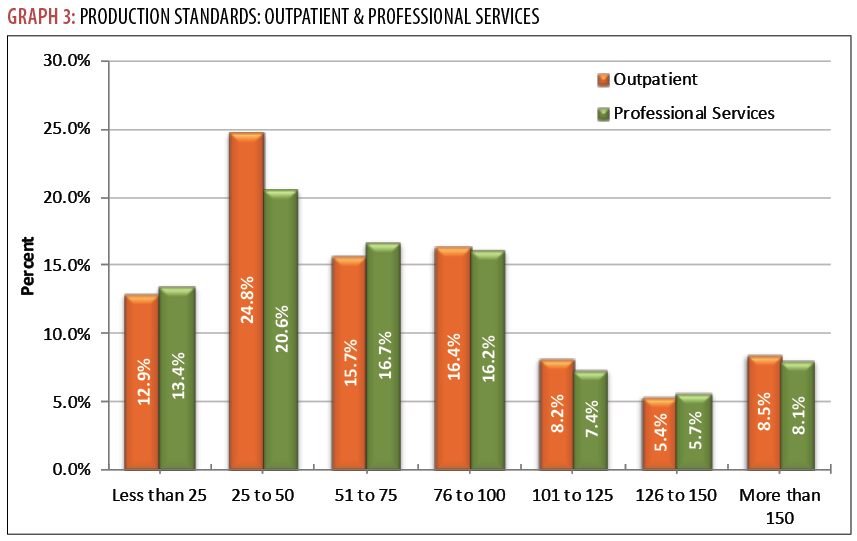
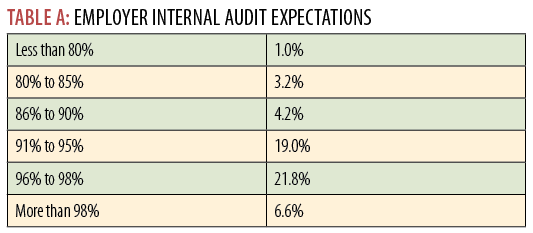
Approximately 21 percent of inpatient coders are expected to code more than 40 claims a day, while approximately the same number of outpatient and physician coders are expected to code 25–50 claims per day. And nearly 41 percent of employers hold their coders to a 91–98 percent accuracy rate.
Education Is Key
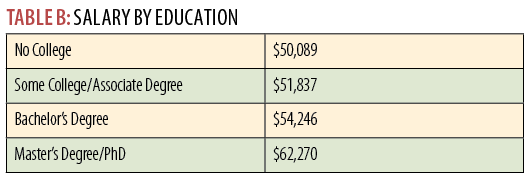
The discrepancy in compensation among job responsibilities is also partly due to academic requirements. Medical coding and billing positions do not usually require a college degree, whereas most managerial and teaching positions require higher education. As shown in Table B, members with a master’s degree or PhD command the most annual compensation. Does that mean an inexperienced medical coder with a master’s degree can expect to earn $62,000 a year? Not likely. As shown back in Graph 1, those higher-paying salaries typically go to practice managers and educators.
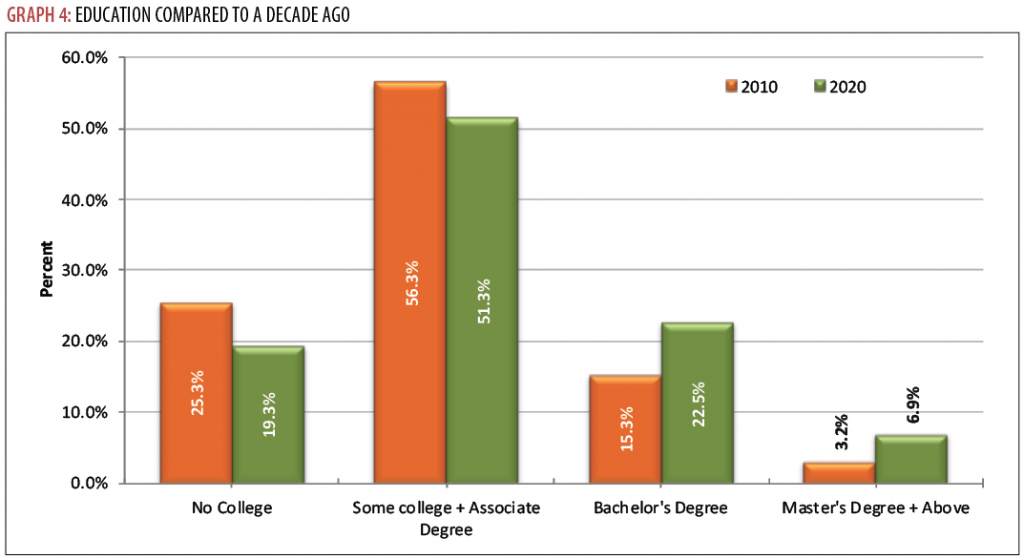
Regardless, employers are looking for applicants with impressive resumes, and education is one way to gain an advantage in a competitive job market. AAPC stresses this point every year and members must be listening. As shown in Graph 4, many more members are obtaining a bachelor’s degree than did 10 years ago, and the number of members who hold a master’s or PhD has more than doubled since 2010. This uptick in education may be partly due to the spike in unemployment in 2020. Those who used any downtime to improve their resumes will come out on top.
Professional Development Shows Value
Credentials also give our members the upper hand in securing their dream jobs and commanding top pay. The value of credentials is seen in our members’ salaries, as shown in Graph 5, on the next page. Although these results are reliant on the other factors (experience, job responsibility, location, etc.), AAPC credentialed members prove again and again to be highly employable.
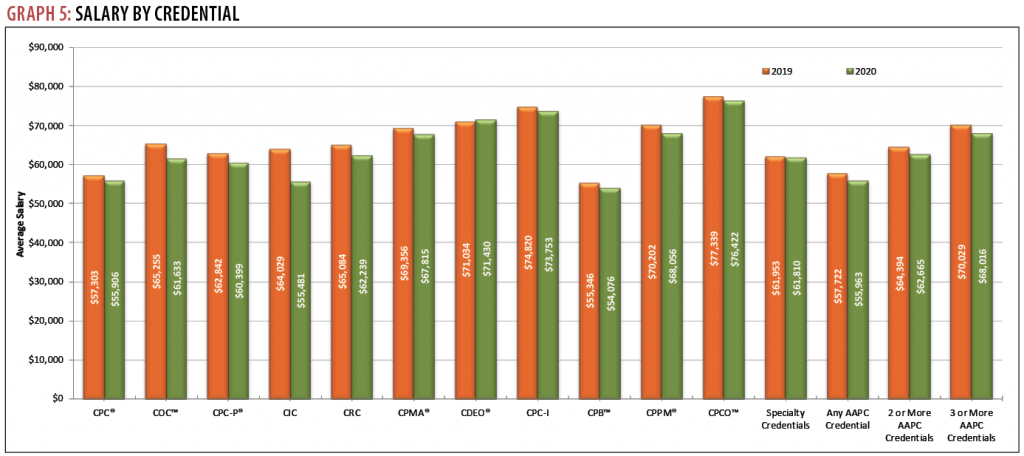
“Even when they’re retiring, our members are not giving up their credentials, perhaps using them in other ways,” says AAPC Senior Vice President of Products Raemarie Jimenez, CPC, CIC, CPB, CPMA, CPPM, CPC-I, CDEO, CANPC, CRHC, CCS.
Time Is on Your Side
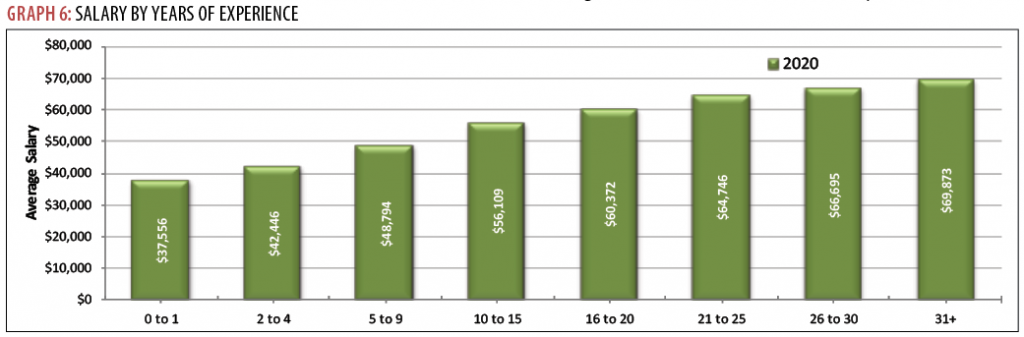
The years of experience you have under your belt also play a key role in compensation. Our members have an average 11.8 years of experience. According to our survey, members with zero to one year of experience make an average of $37,556 starting out, regardless of job responsibility. But, as shown in Graph 6, over the course of their careers, some are nearly doubling their salary, depending on the paths they take.
Where You Work Matters
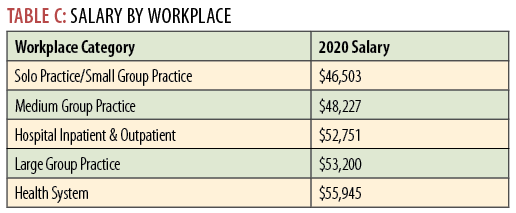
Another factor that influences compensation is where you work. As shown in Table C, health systems generally pay the most, followed by large group practices and then hospital inpatient and outpatient facilities. It stands to reason that smaller practices pay the least. Before you put in your notice, however, remember that more patients mean more claims; hospitals may pay more than primary care practices, but you’ll earn every penny.
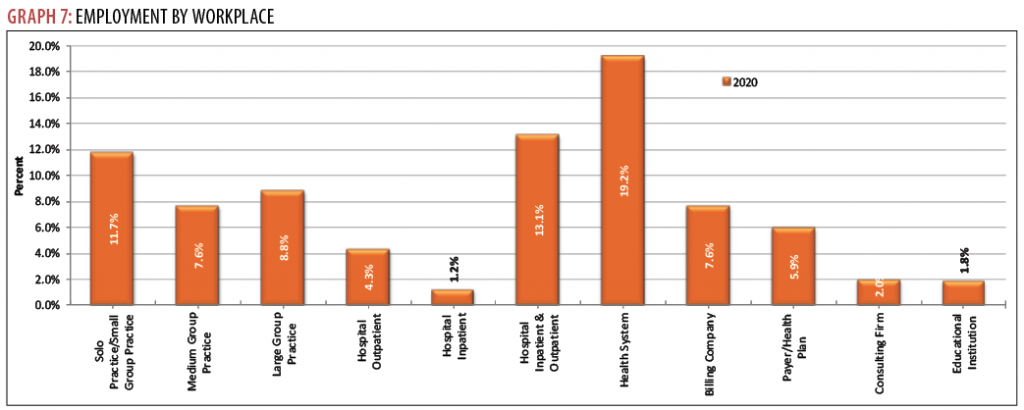
Shown in Graph 7, most of our members work in either a solo or small group practice (11.7 percent), a hospital inpatient/outpatient facility (13.1 percent), or a health system (19.2 percent). Only 1.8 percent of members — those reportedly paid the most — work at an educational institution. The number of AAPC members employed by large group practices continues to decline — 8.8 percent this year compared to 9.7 percent last year. This is likely due to acquisitions and mergers between these entities and health systems.
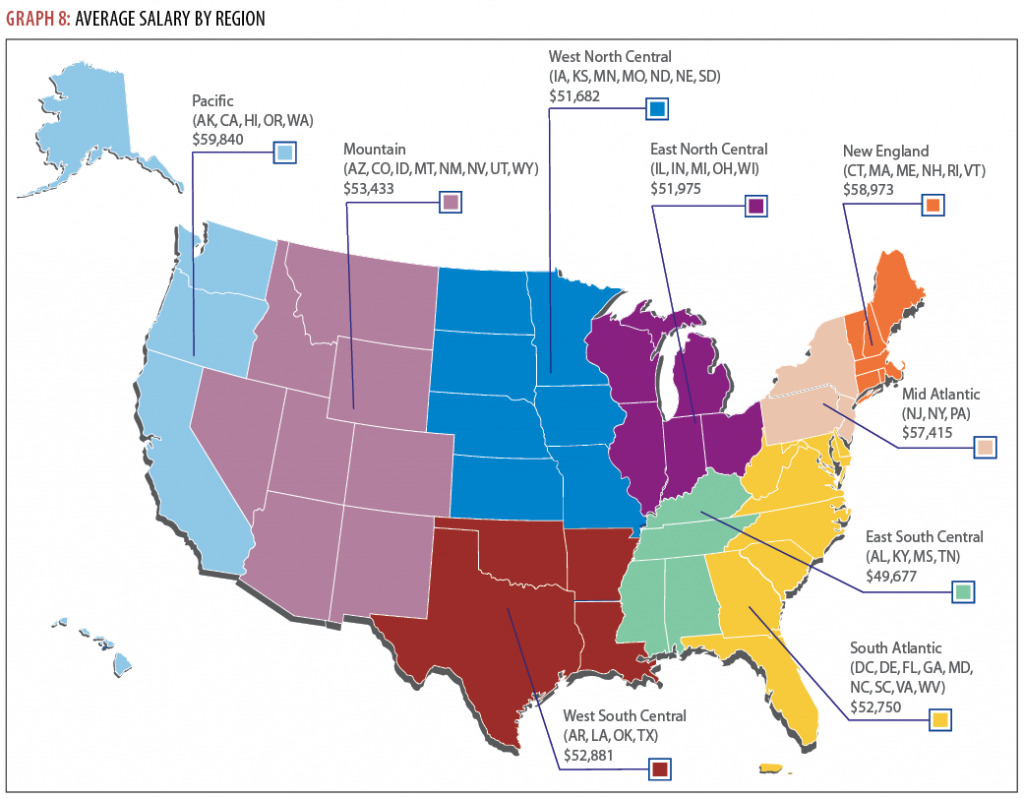
Where on earth you work factors into compensation, as well. As shown on the U.S. map, our members on the Pacific Coast averaged $59,840 last year, whereas members on the South Atlantic Coast averaged $52,750. When you factor in the cost of living, however, these numbers balance out (Graph 8).
The COVID-19 Effect on Jobs
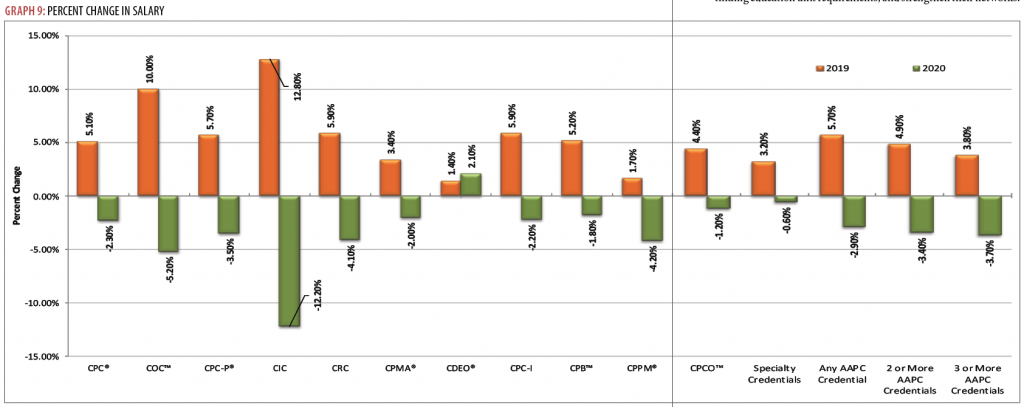
As we alluded to earlier, unemployment among our members skyrocketed to an average 11.3 percent in 2020, compared to 6.9 percent in 2019, with apprentices being the hardest hit. Meanwhile, it has not been status quo for those who have remained employed throughout this historic event. As shown in Graph 9, salaries were down an average 3.5 percent — except for members with the Certified Documentation Expert Outpatient (CDEO®), who reported a 2.1 percent salary increase in 2020. The decrease may be partly due to working fewer hours — approximately 70 percent of respondents said they are paid by the hour and more than half reported working fewer hours than in past years. With physicians furnishing fewer elective procedures in 2020 because of the PHE, it stands to reason coders and billers were not asked to work overtime.
Job Satisfaction Scores High
Despite all the challenges in 2020, job satisfaction was up. We’re pleased to report that 60.6 percent of our members say they are happy in their jobs, with 47.2 percent of those happy clams being very satisfied and 41.2 percent being somewhat satisfied. More than likely, this job satisfaction is due to a culmination of things such as benefits and workplace environment.
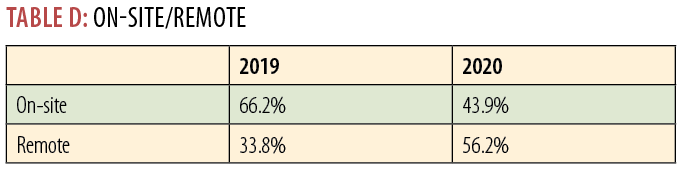
Flexibility is also a benefit. Medical coding historically offers significantly higher remote work than most others (before COVID-19, at least). As shown in Table D, more than half of members reported working remotely in 2020 (an approximate 20 percent increase over the year before). We know what caused this dramatic uptick in telecommuting, but it is too early to tell whether this trend will be permanent or how it will change the workplace dynamic.
Time to Rally!
Many of our members saw 2020 as an opportunity to advance their learning through continuing education, get caught up on their continuing education unit requirements, and strengthen their networks. Some jumped on opportunities in other areas of healthcare in which their coding skills are an added value. We commend all of you for staying the course. We will overcome the hardships COVID-19 brought us by becoming stronger through relationships, knowledge, and determination. Onward and upward!
Unhappy in Your Work? Here’s Why
We asked members: If you are looking for a different job, why? Although 60.6 percent of respondents said they were not looking for a new job, only 47.2 percent said they were “very satisfied” in their current position. Of the 38.4 percent who are looking for a new job, which may include some of the 41.2 percent “somewhat satisfied” members, here’s why (ranked from 8 being the most prevalent):
8. I want to make better use of my skills/knowledge.
7. I want to engage in more rewarding work.
6. I want a shorter commute.
5. I am worried my job will be outsourced.
4. I don’t enjoy the work environment where I am.
3. I want to work remotely.
2. I want advancement opportunity.
1. I want more money.
Analytics Contributor:
Dave Blackmer, MSC, has over a decade of experience in healthcare marketing and operations. He currently oversees all the marketing at CenExel, a leading clinical research site network. He has published and collaborated on dozens of industry articles and is a frequent speaker at healthcare, marketing, and tech conferences around the country. Blackmer earned a master’s degree in strategic communication from Westminster College.
How We Conduct This Survey
We conduct our annual salary survey between Oct. 1 and Dec. 31, using SurveyMonkey. Due to production schedules of this magazine, the final results of this salary survey will be posted on our website. The results shown here are preliminary, based on 21,000 respondents.

- HCPCS Level II July Update Files Now Available - May 3, 2024
- Laboratories: Get Ready for PLA Code Changes - May 2, 2024
- FY 2025 IPPS/LTCH Proposed Rule Forecasts the Future for Hospitals - May 2, 2024


Is there anyway to find out how this study was conducted? Who was asked to participate in this survey.
Jolynn,
We conduct our annual salary survey between Oct. 1 and Dec. 31, using SurveyMonkey. Any AAPC member can participate. There were 21,000 respondents for this survey.