2017 Salary Survey: Right on the Money
- By Dave Blackmer, MSC
- In AAPC News
- January 31, 2018
- 11 Comments

Editor’s Note: Check out the latest data, just posted.
UPDATED: The final data, based on the statistics gathered through March 1, 2018, is reflected in this Salary Survey Infographic. You can also use our Salary Survey Calculator to find more information based on your situation.
AAPC credentials pave the way for many paths to success.
With almost 13,000 responses to AAPC’s 2017 Salary Survey, and the data indicating overall higher pay for healthcare business professionals than the year before, 2017 was a good year. For all employed respondents, the average salary climbed nearly 6 percent, to $52,648.
Even better, the overall respondent unemployment rate dropped from 6.6 percent to 5.9 percent. Although this is still above the U.S. national average, we’ve noticed a trend in the data that may help those who are still looking to get hired. The challenge may be rooted in education, but not in the way you might think.
Education is crucial; however, if you’re looking for a job, don’t let your academic background get in the way of taking a stepping stone position.
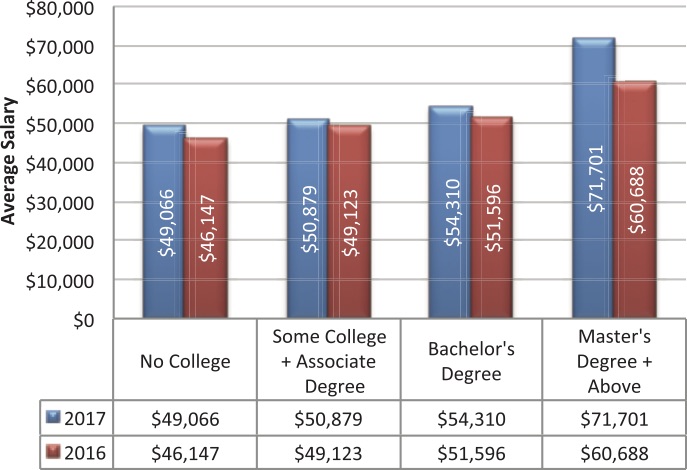
Advanced education carries the highest jump in value at the top levels. This year, those with a master’s degree or higher are making 32 percent more than those with a bachelor’s degree, alone, and over 46 percent more than those with no college experience.

Multiple Paths to Success
Our respondents prove, once again, that there are various ways you can reach the financial heights of your career: through higher education, additional certification, or work experience. These three routes offer similar monetary outcomes for the informed individual (keep reading…), commensurate with growth in the respective area. Of course, combining any or all of the three options would indicate elite status and merit even more remuneration.
Since 2011, every AAPC Salary Survey shows a marginally higher rate of unemployment (usually a couple percentage points) among those who hold a college degree versus those who don’t. We infer this to mean that individuals who have no college degree are more willing to accept any position in healthcare— perhaps even a job considered menial, which pays little — to at least be working in their chosen profession.
Graph A shows the 2017 average salary changes compared to 2016, based on education levels.
Certain credentials merit higher pay rates; since 2008 the CPC-I (for instructors) has held the top spot when comparing certifications to salaries, save for one year. For 2017, the CPC-I salary average was $75,077, and Certified Professional Compliance Officer (CPCO™) came in at a close second (a title it has held frequently in the past) with $74,557.
The Certified Professional Practice Manager (CPPM®) credential was third with $67,234, which is comparable to its average from last year, and just barely above the average for Certified Documentation Expert – Outpatient (CDEO®), which came in at $66,413, and is still proving to be in high demand. Both the CPPM® and CDEO® certification salary averages are comparable to the average amount earned by those who hold three or more credentials.
Table A shows the 2017 average salaries, based on credentials, along with the average years of experience and average quantity of credentials each respondent possesses.
TABLE A CREDENTIAL AVERAGES (Salary, Experience, Certifications Held)
| Average Salary | Average Years of Exp | Average # Certs | |
| CPC | $54,106 | 13 | 2 |
| COC | $60,449 | 13 | 3 |
| CPC-P | $61,567 | 16 | 2 |
| CIC | $49,123 | 9 | 2 |
| CRC | $62,541 | 10 | 3 |
| CPMA | $64,804 | 14 | 3 |
| CDEO | $66,413 | 11 | 5 |
| CPC-I | $75,077 | 18 | 4 |
| CPB | $51,778 | 12 | 3 |
| CPPM | $67,234 | 18 | 3 |
| CPCO | $74,557 | 16 | 4 |
| Any Specialty Credential | $58,648 | 14 | 1 |
| Any AAPC Credential | $54,274 | 13 | 1 |
| 2 or more AAPC Credentials | $60,899 | 13 | 3 |
| 3 or more AAPC Credentials | $66,256 | 15 | 4 |
Key points to notice from Table A:
- The average salary of those who hold any AAPC credential is $1,626 higher than the average for all employed respondents.
- Of the 11 non-specialty AAPC credentials, eight of them (more than ever before) average a salary higher than $60,000.
- The credentials linked with the highest salaries also tend to be linked with more years of experience and multiple certifications.
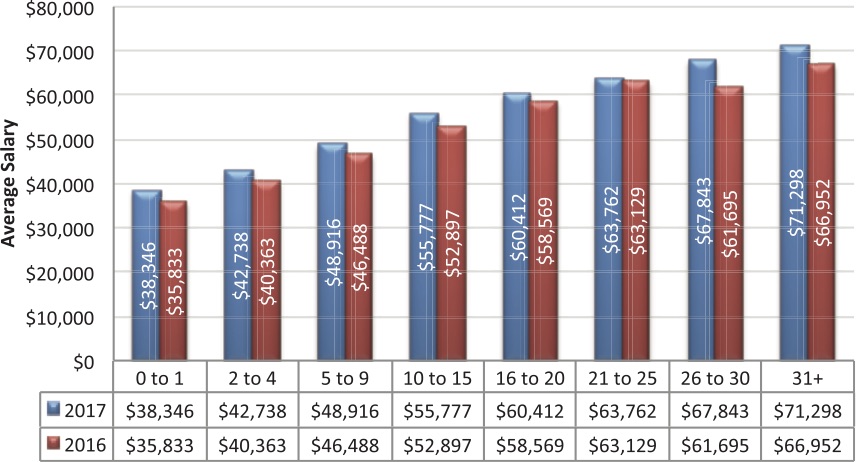
As always, there is a clear trend of average salary increase with more years of experience. The biggest areas of growth this year came for those with 26-30 years of experience (10 percent salary improvement over 2016) and those who are just starting out in the industry (7 percent salary improvement over 2016). When comparing the ranges of years of experience to each other, however, the five- to nine-year range is consistently where we see the largest spike in average salary. There’s still growth after that, but this level seems to be a real turning point.
Graph B shows the 2016 and 2017 average salaries, based on experience.
Over the past few years, many respondents selected the highest option for years of experience. In response, we’ve gradually offered a wider range of years. In 2015, for example, 5 percent of the respondents marked 31+ years of experience. In 2016, 2 percent of the respondents marked 36+ years of experience. In 2017, 1 percent marked 41+ years of experience. The range finally seems wide enough to encompass sufficient possibilities for all respondents. But in addition to gathering more specific data, the numbers tell an important story:
- We have a high number of healthcare business professionals with a wealth of experience. These seasoned professionals’ insight and expertise are essential to our industry.
- There may be an influx of job openings soon as these veterans retire.
Employers will be looking for individuals who embrace the new technologies and digital advancements coming to all facets of healthcare. For those in the middle stages of their career, now is the ideal time to prepare to take over those responsibilities, either through going back to school, earning additional certifications, or just making sure the years of work experience speak for themselves.
One way many respondents go the extra mile to illustrate their dedication in work experience is by putting in extra hours. The majority (57 percent) still works a regular 40-hour week, but nearly 30 percent of the respondents work 41-50 hours per week, with another 5 percent who say they work beyond that. Those who work overtime are almost evenly split between being paid hourly versus salary, and they make an average of $60,304.
Where We Work and What We Do
The 2017 data didn’t show much of a change in terms of where individuals are employed, but health systems continue to grow (from 18.2 percent of the respondents to 20.8 percent). Hospital outpatient facilities and large group practices saw a bit of a decline since 2016 (1 percent and 1.6 percent difference).
When comparing employment types and experience levels, the percentages of where respondents worked showed minimal fluctuation, almost regardless of the amount of experience. At the highest levels (31+ years of experience), respondents indicated the widest workplace diversity, probably because they have more options available to them. Salary averages can be determined by workplace, as well.
Graph C shows the 2016 and 2017 average salaries, based on workplace.
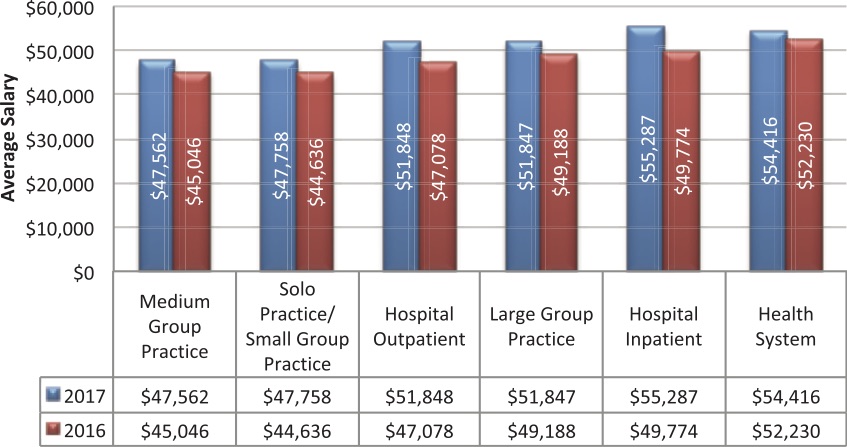
Of the most common workplaces, hospitals saw the largest increase in average salary for 2017. The average salary for those working in outpatient facilities rose 10.1 percent, while inpatient facility employees’ salaries rose 11.1 percent.
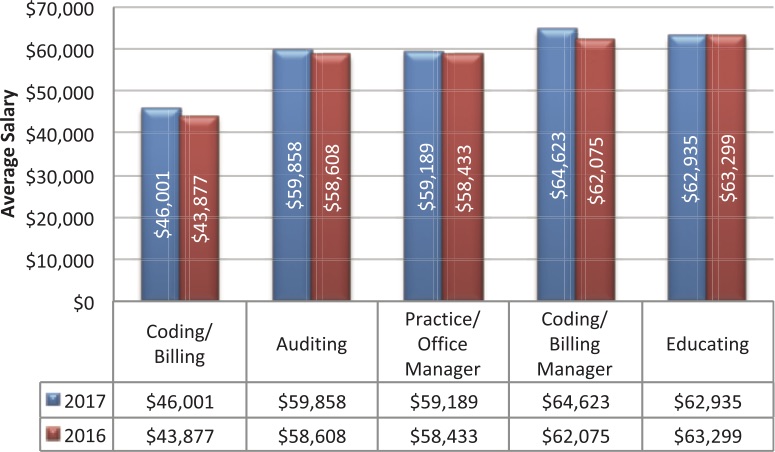
For the first time since 2013, coding and billing managers earned the highest average salary, coming in with $64,623 in 2017. For those who want to stick to the coding and billing arena, management in this field may be the best career plan. Of the most common responsibilities, coding and billing managers have maintained one of the top three average salaries (usually the second) since 2008.
Coding and billing managers also saw a decent increase in average salary over the 2016 numbers, coming in 4.1 percent higher in 2017. Coders and billers were the only group to top that by improving on their 2016 average salaries by 4.8 percent.
Graph D shows the 2016 and 2017 average salaries, based on job responsibility.
Analyzing job responsibilities by years of experience indicates some interesting trends. Practice and office managers and educators show very similar percentages of slow, steady increase as healthcare experience grows. Some break into coding and billing management within the first decade of their career, but after about 15 years of experience, coding and billing management seems to hit a plateau and hold steady at around 10-12 percent of the populace. Auditors peak at 21-25 years of experience, and then begin to taper off in the following years.
High Standards for Some
Only one-third of respondents have production standards set by their employer, while about half of the respondents work in environments where internal audits are conducted, with set requirements for accuracy rates. Having production and accuracy guidelines in place usually comes with more pros than cons, provided expectations stretch employees to perform their best while remaining realistic. Look for an article in an upcoming Healthcare Business Monthly for the specifics of those pros and cons, and analysis of the standards considered to be ideal.
Of those who indicated they had production standards for an inpatient setting, more than half marked the survey’s highest option: more than 15 records handled per day. For outpatient and professional services, the largest responses were on the opposite end of the spectrum, with a little over a quarter of the respondents indicating they were held to a standard of less than 50 records per day, the survey’s smallest option. And for both outpatient and professional services, nearly 15 percent of the outpatient respondents said they are required to handle more than 150 records per day.
About a quarter of those who must maintain accuracy rates are held to the highest quality of work: more than 95 percent accuracy. Roughly 20 percent of the respondents said they must maintain a 91-95 percent accuracy rate.
Tables B, C, D, and E show employers hold their employees to diverse standards, depending on place of service.
TABLE B PRODUCTION STANDARDS: INPATIENT
| Less than 5 | 9.4% |
| 5 | 3.5% |
| 6 to 10 | 16.3% |
| 11 to 15 | 16.1% |
| More than 15 | 54.8% |
TABLE C PRODUCTION STANDARDS: OUTPATIENT
| Less than 50 | 27.8% |
| 50 to 75 | 22.9% |
| 76 to 100 | 18.7% |
| 101 to 125 | 10.6% |
| 126 to 150 | 6.8% |
| More than 150 | 13.2% |
TABLE D PRODUCTION STANDARDS: PRO SERVICES
| Less than 50 | 27.3% |
| 50 to 75 | 22.2% |
| 76 to 100 | 18.1% |
| 101 to 125 | 9.8% |
| 126 to 150 | 8.0% |
| More than 150 | 14.6% |
TABLE E ACCURACY RATE REQUIREMENTS
| Less than 80% | 0.8% |
| 80% – 85% | 3.5% |
| 86% – 90% | 4.7% |
| 91% – 95% | 19.3% |
| More than 95% | 24.9% |
Calculating for the Cost of Living
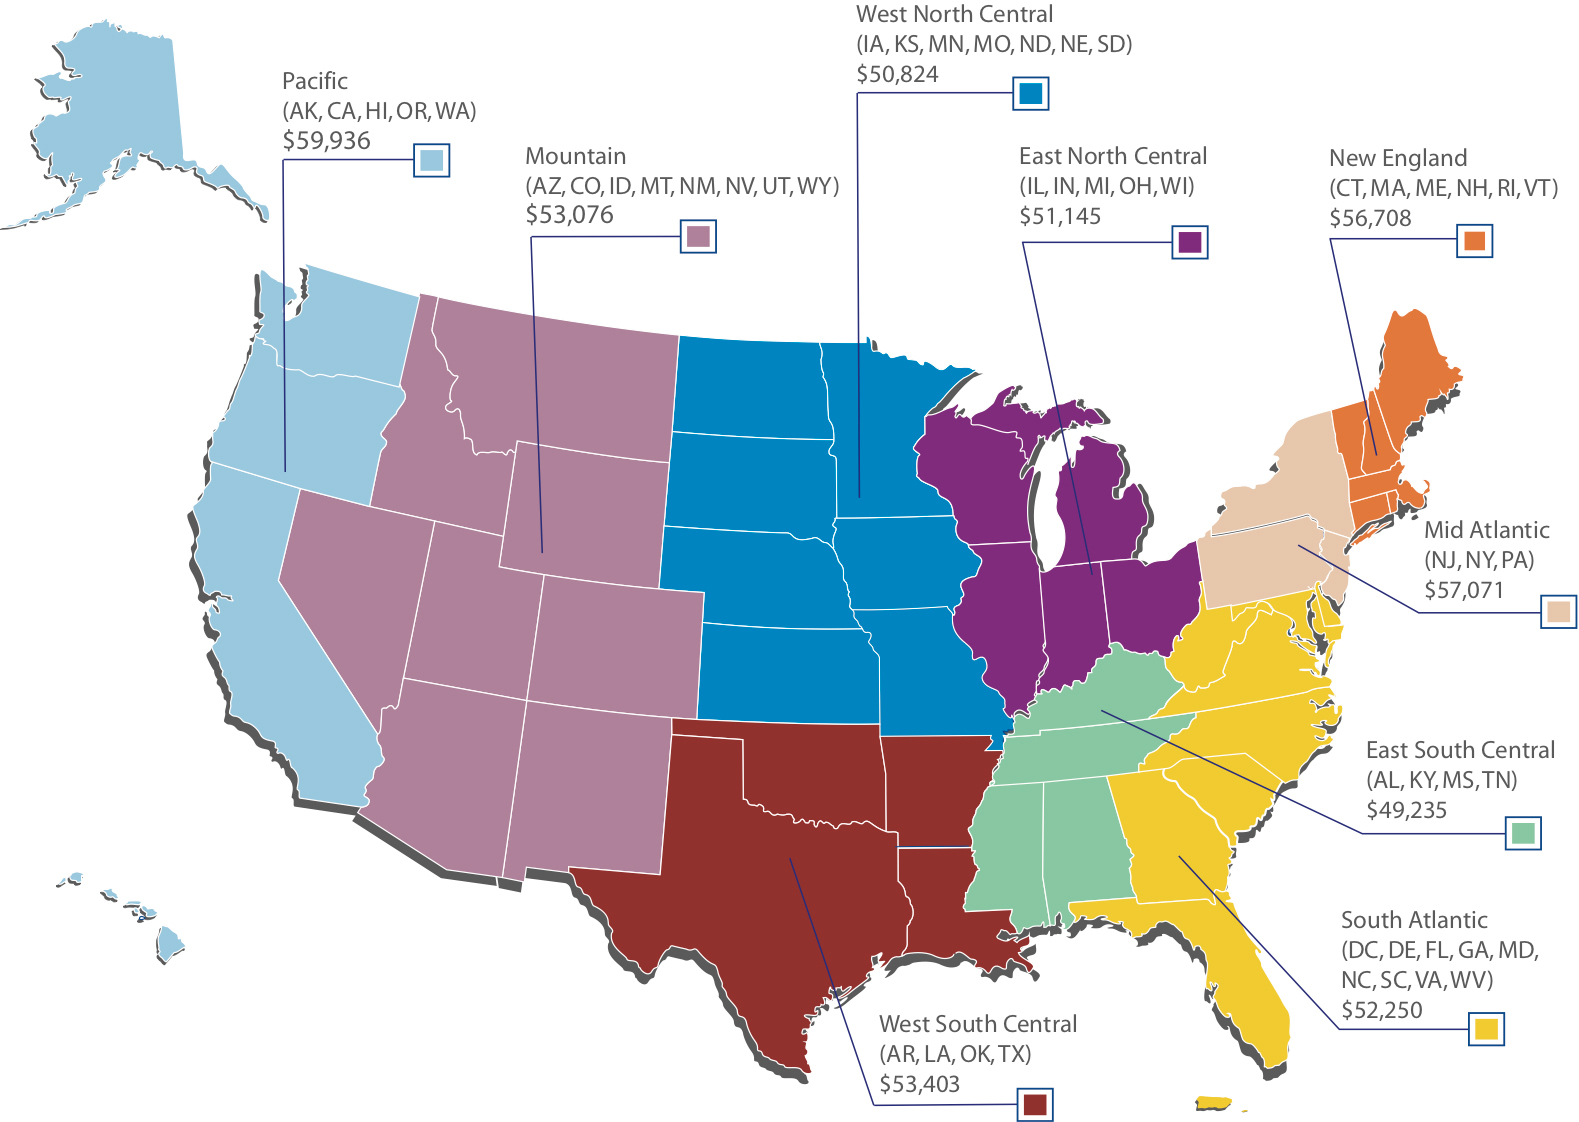
Average salaries improved across all U.S. regions in 2017, with about a $10,000 range, which is normal. The West South Central region saw the largest salary advancement, with a 7.3 percent raise over the 2016 data. Considering that in 2015 and 2016, this region saw slight decreases in year-over-year salary averages, this seems like a long overdue raise. The Pacific region is consistently the highest paid, while the East South Central region is normally the lowest paid.
Graph E shows the 2017 average salaries, based on region.
There’s Still Time to Participate
AAPC will soon launch a new tool: the Salary Survey Calculator. This tool will let you pick the filters for the data and see what the average salary is under those conditions. Employers and employees alike may use this tool to determine appropriate compensation plans based on specified parameters. In preparation for the launch of this tool, and to gather as much data as possible, the 2017 Salary Survey remains open through the end of February 2018.
If you didn’t get a chance to participate in the survey, you can do so here. We’ll close the survey on March 1, 2018, and update the online information shortly thereafter. The statistics noted in this article are based on the data gathered as of January 1, 2018
*Note: The 2017 Salary Survey is sponsored in part by AAPC’s national conference, HEALTHCON 2018.
- Medical Coding and Billing Salary Survey 2019 - January 29, 2020
- Justify Your Job Expenses - March 7, 2019
- Know 2018 Salaries with New Calculator - February 19, 2019


Does AAPC have any financial assistance?
Yes. The hardship scholarship fund:
https://www.aapc.com/memberarea/chapters/scholarship.aspx
I am CPC certified coder working in India . currently in India Medical coding salaries are very less. Our plan is to work in USA . Please give suggestions how to get opportunity to work in USA
I doing the billing in the hospice since 2008 and before that am also doing billing in physician’s office in 2001 but I don’t have any certification.What can you advise for me, do I need to get certification for medical billing or coding? Do I need to take the pre-requisites?
Thank you.
Hi
I’ve been in the billing/coding field since 1994 working with mainly institutional and professional claims. I have taken a course being mislead about the coding certification. Decided to take another about 5 years ago with a promise of the coding certification test for the school to go bankrupt and close its doors without warning..I am interested in obtaining some courses as I believe this is what you offer. I just dont know where to start. Is it possible for someone to reach out to me regarding this? I would appreciate the guidance.
Thank you
Are remote home coders paid salary or hourly?
I’d love to know specific categories by region. Ex: Hospital Outpatient, Los Angeles Area
I am a new coder, but everybody in the applications required years of experience. How I make to get a Job?.
I am a new coder, but everybody in the applications required years of experience. How I make to get a Job?.
What will be salary for fresher with certification in india
For the new coders, I was a new coder as well, but I applied anyway and they were willing to train even though the they “required” experience. Outpatient coding is the best way to go to get your foot in the door before applying for inpatient billing. Hope this helps!